Investors
Consult or download our latest updated documents
2025 Half-Yearly Financial Report
2024 Annual Report
2025 1st Half financial information
Financial Statements
Key figures of the Aubay Group

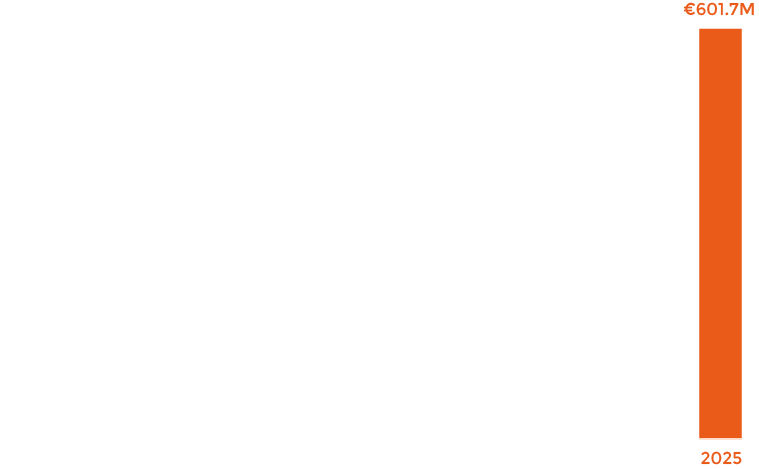
Progression of Gr turnover
Progression of Gr turnover
2023 : 534,1 M€. 2022 : 513,5 M€. 2021 : 470,6 M€. 2020 : 426,4 M€. 2019 : 417,8 M€. 2018 : 400,6 M€. 2017 : 348,7 M€. 2016 : 326,4 M€. 2015 : 273,8 M€.

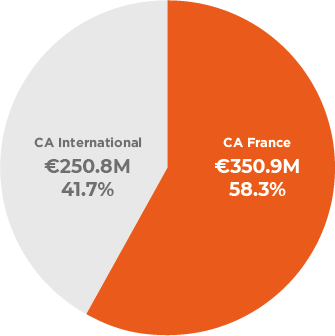
Turnover distribution of the Aubay Group
Turnover distribution of the Aubay Group
CA France : 280,5 M€ 52,5%. CA International : 253,6 M€ 47,5%

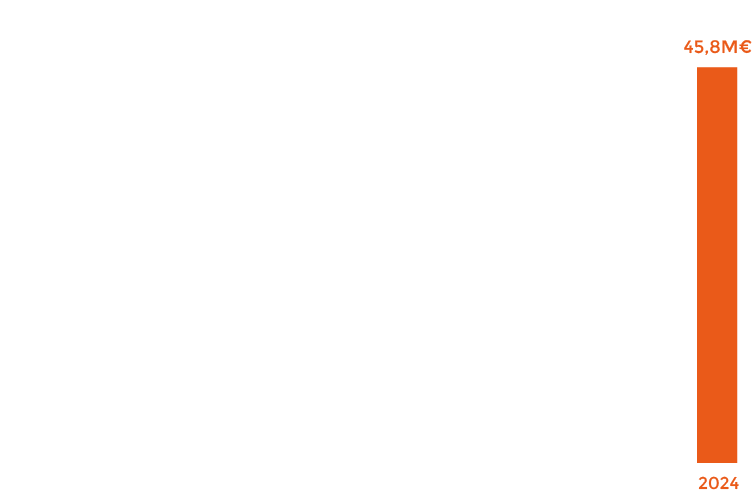
Progression of operating income
account of the Aubay Group
Progression of operating income account of the Aubay Group
Aubay share price
Stock market information
Euronext,
Compartiment B
ISIN
FR0000063737-AUB
Reuters
AUBT.PA
Bloomberg
AUB:FP
Analysts


—
Contacts
Aubay Group – David Fuks
dfuks@aubay.com
Phone : +33 (0)1 46 10 67 67
Actus Finance – Amaury Dugast
adugast@actus.fr
Phone +33 (0)1 53 67 36 74


